Custom Data Dashboards for Contact Centers
In the fast-paced world of real-time contact centers, having clear, accurate, and relevant information is essential to achieving your goals.
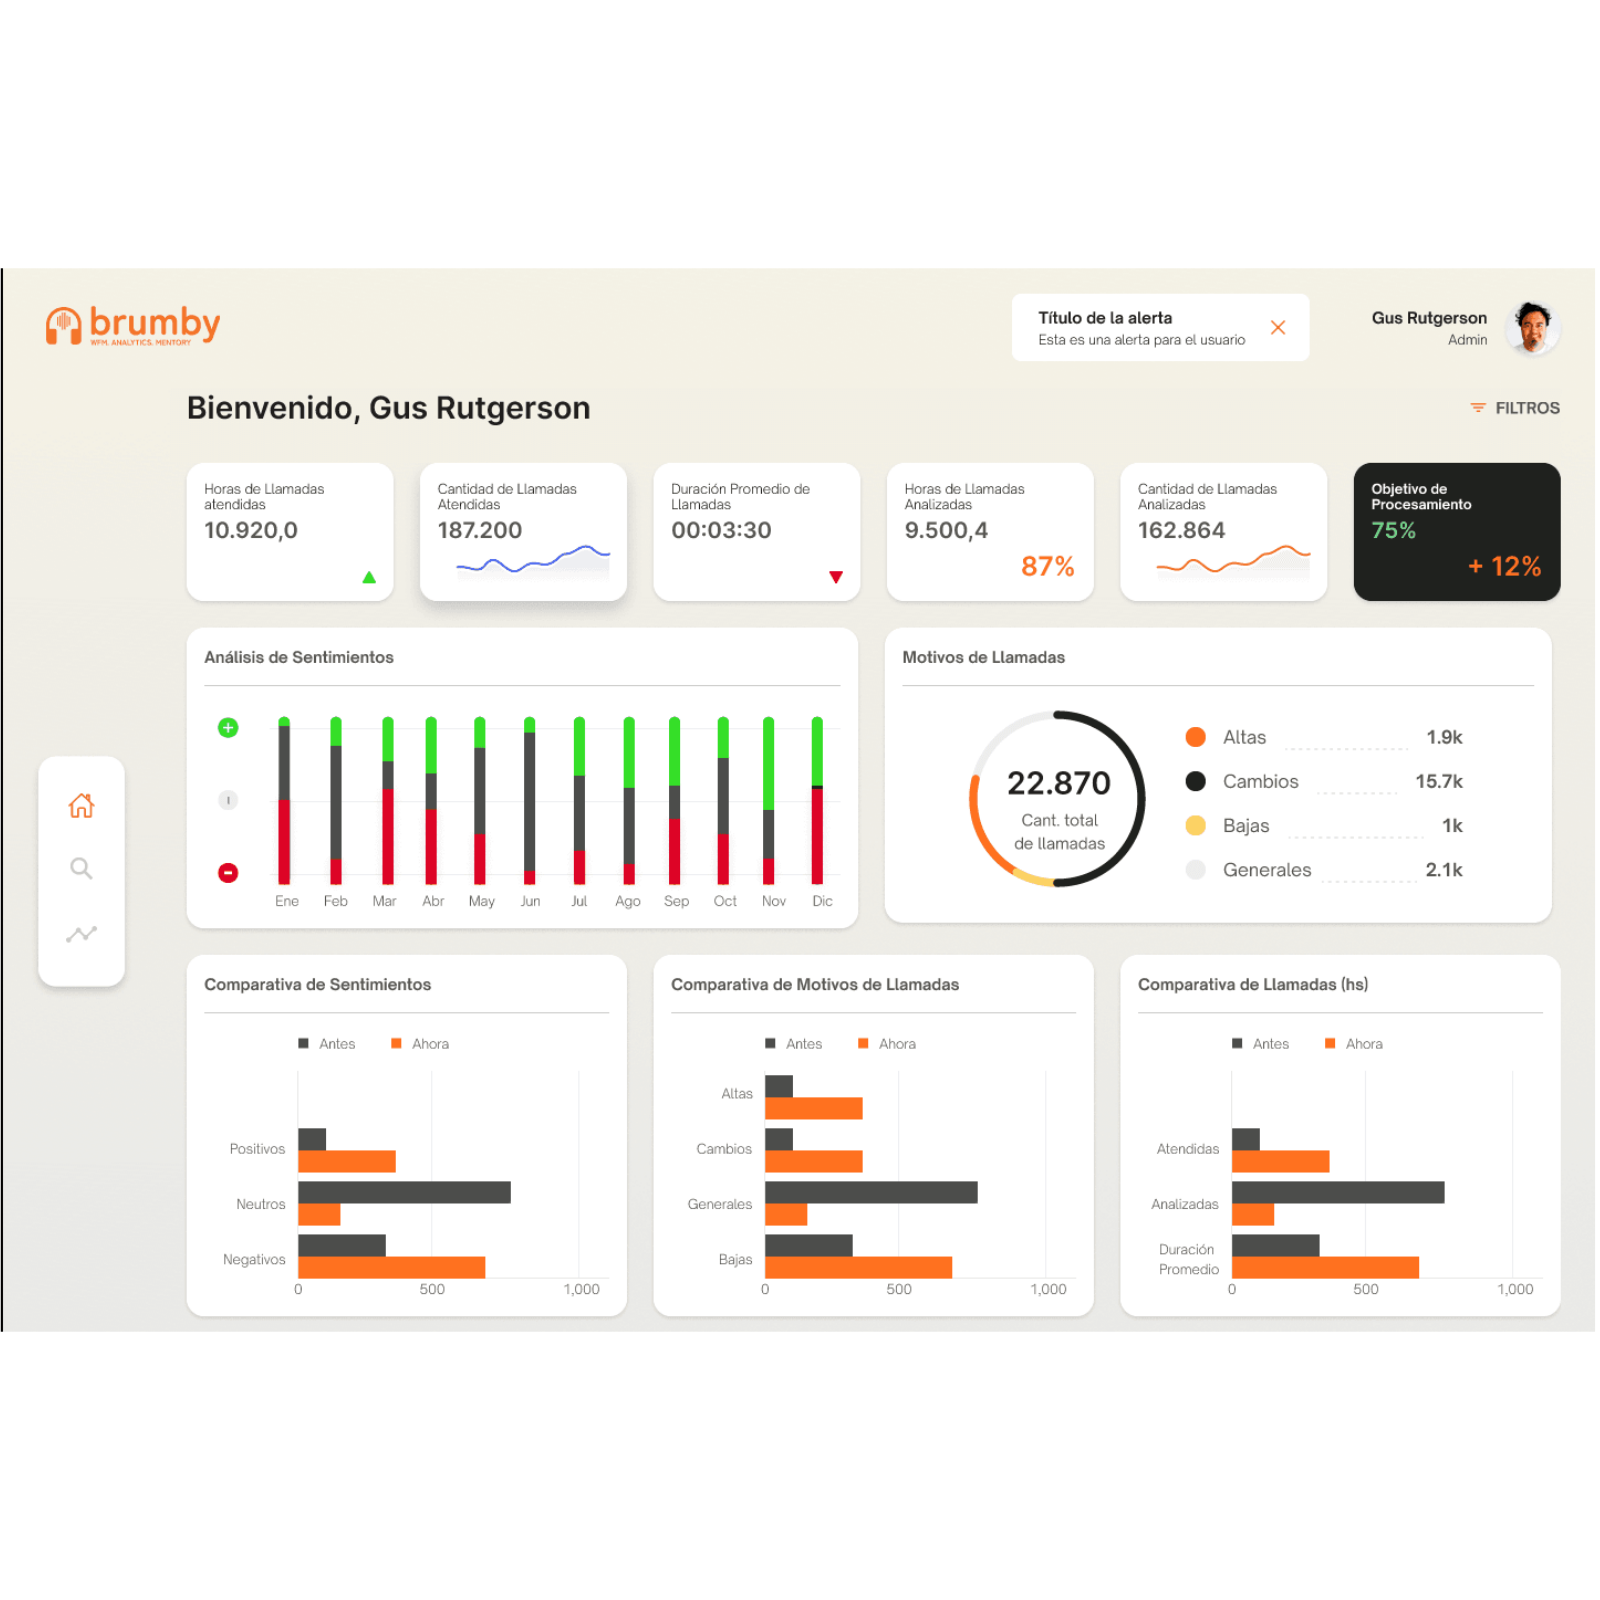
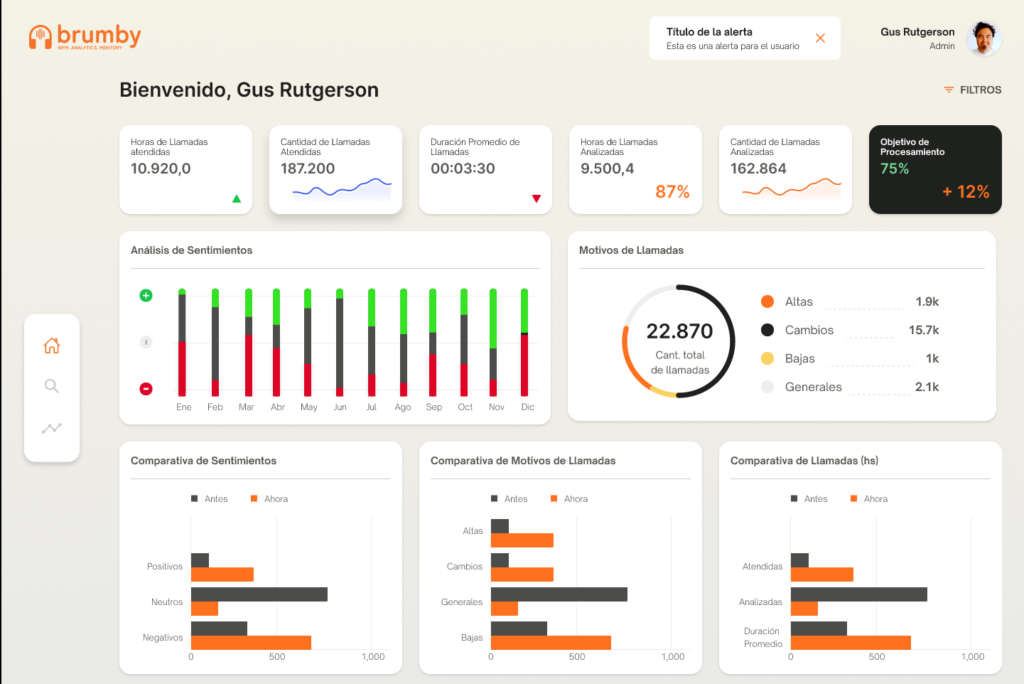
At Brumby, we’ve developed custom data dashboards that leverage dimensions, hierarchies, data nesting, KPIs, and drivers. This combination ensures that every user profile has exactly the information they need to stay focused on their goals.
How critical is an information dashboard?
Imagine piloting a flight without an information dashboard. Now take it a step further: how effective could an air traffic controller be without accurate, detailed information on every flight they oversee?
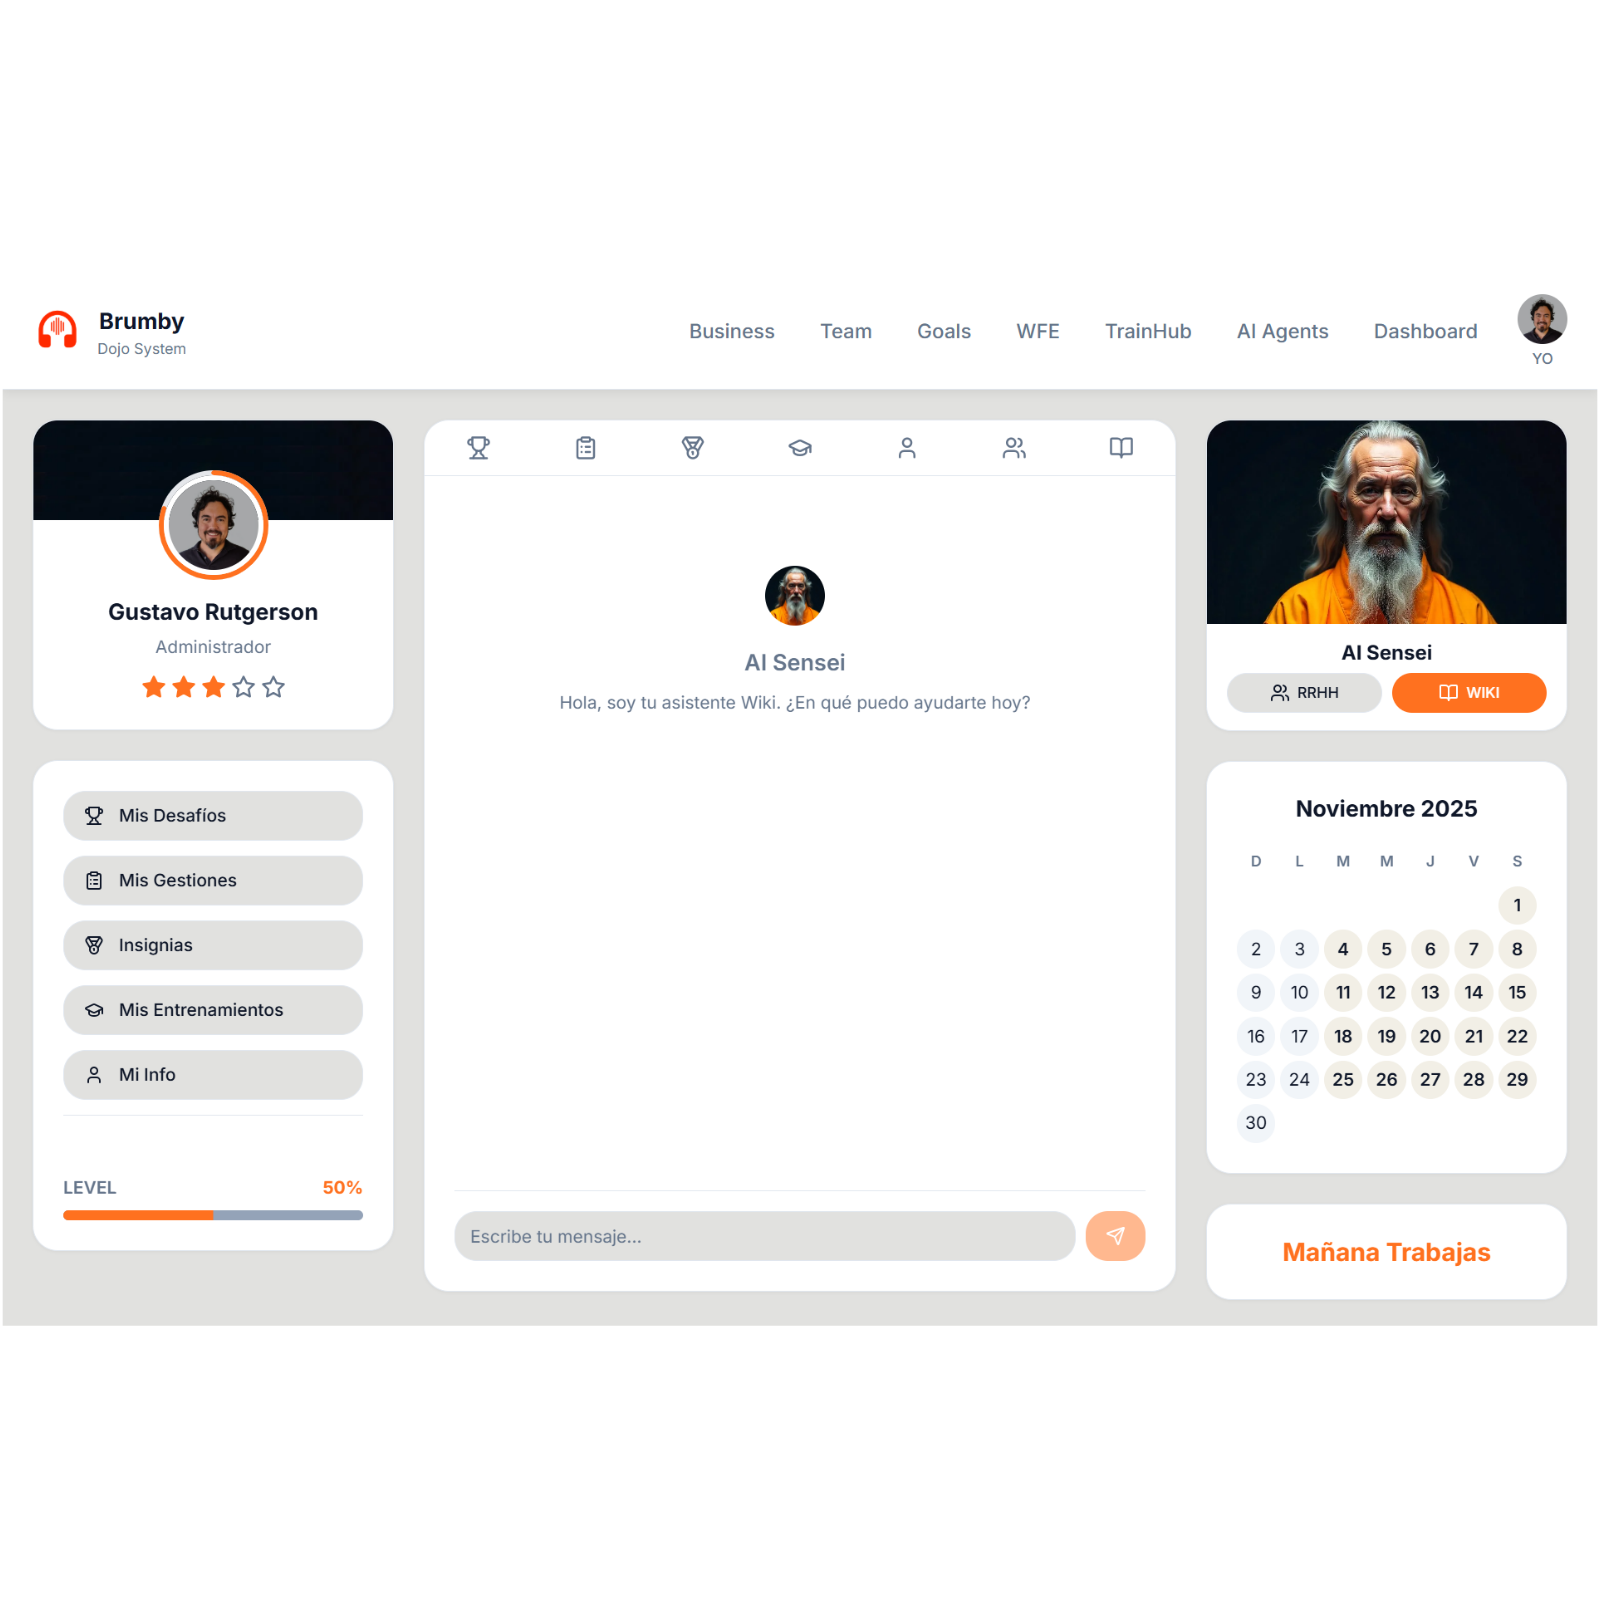
In your operation, agents are like pilots who need clear metrics to meet their goals, while supervisors are the controllers who require a comprehensive, detailed view to coordinate the team. Without proper dashboards, chaos and inefficiency are inevitable.
The solution lies in intelligent data models that not only allow for granular segmentation and analysis but also enable personalization based on the user’s profile.
ChatGPT PlusThe Brumby method for delivering personalized dashboards for every user profile
Our dashboards are built on a robust data model that combines hierarchies, dimensions, and smart filters to deliver personalized, actionable, and high-impact insights.
Hierarchies: The Backbone of Organizational Structure
Hierarchies allow us to organize data across different levels of detail, providing both a high-level overview and in-depth analysis through Drill-down and Roll-up functions.
At Brumby, we implement staff-level hierarchies that adapt to any organizational structure. For example: CEO > Operations Director > Floor Manager > Supervisor > Team Leader > Agent.
This approach enables data to be nested according to each role within the Contact Center.
Dimensions: Categories to Organize and Analyze Data
Dimensions act as categories that organize information and allow it to be segmented for efficient analysis. These dimensions form the foundation on which dashboards are built.
At Brumby, we work with the following dimensions to group, segment, and analyze data: <Campaigns> <Time> <Activity> <Channel Type>
Our table architecture ensures that data is understandable and actionable from any business perspective.
Smart Segmentation to Drive Performance
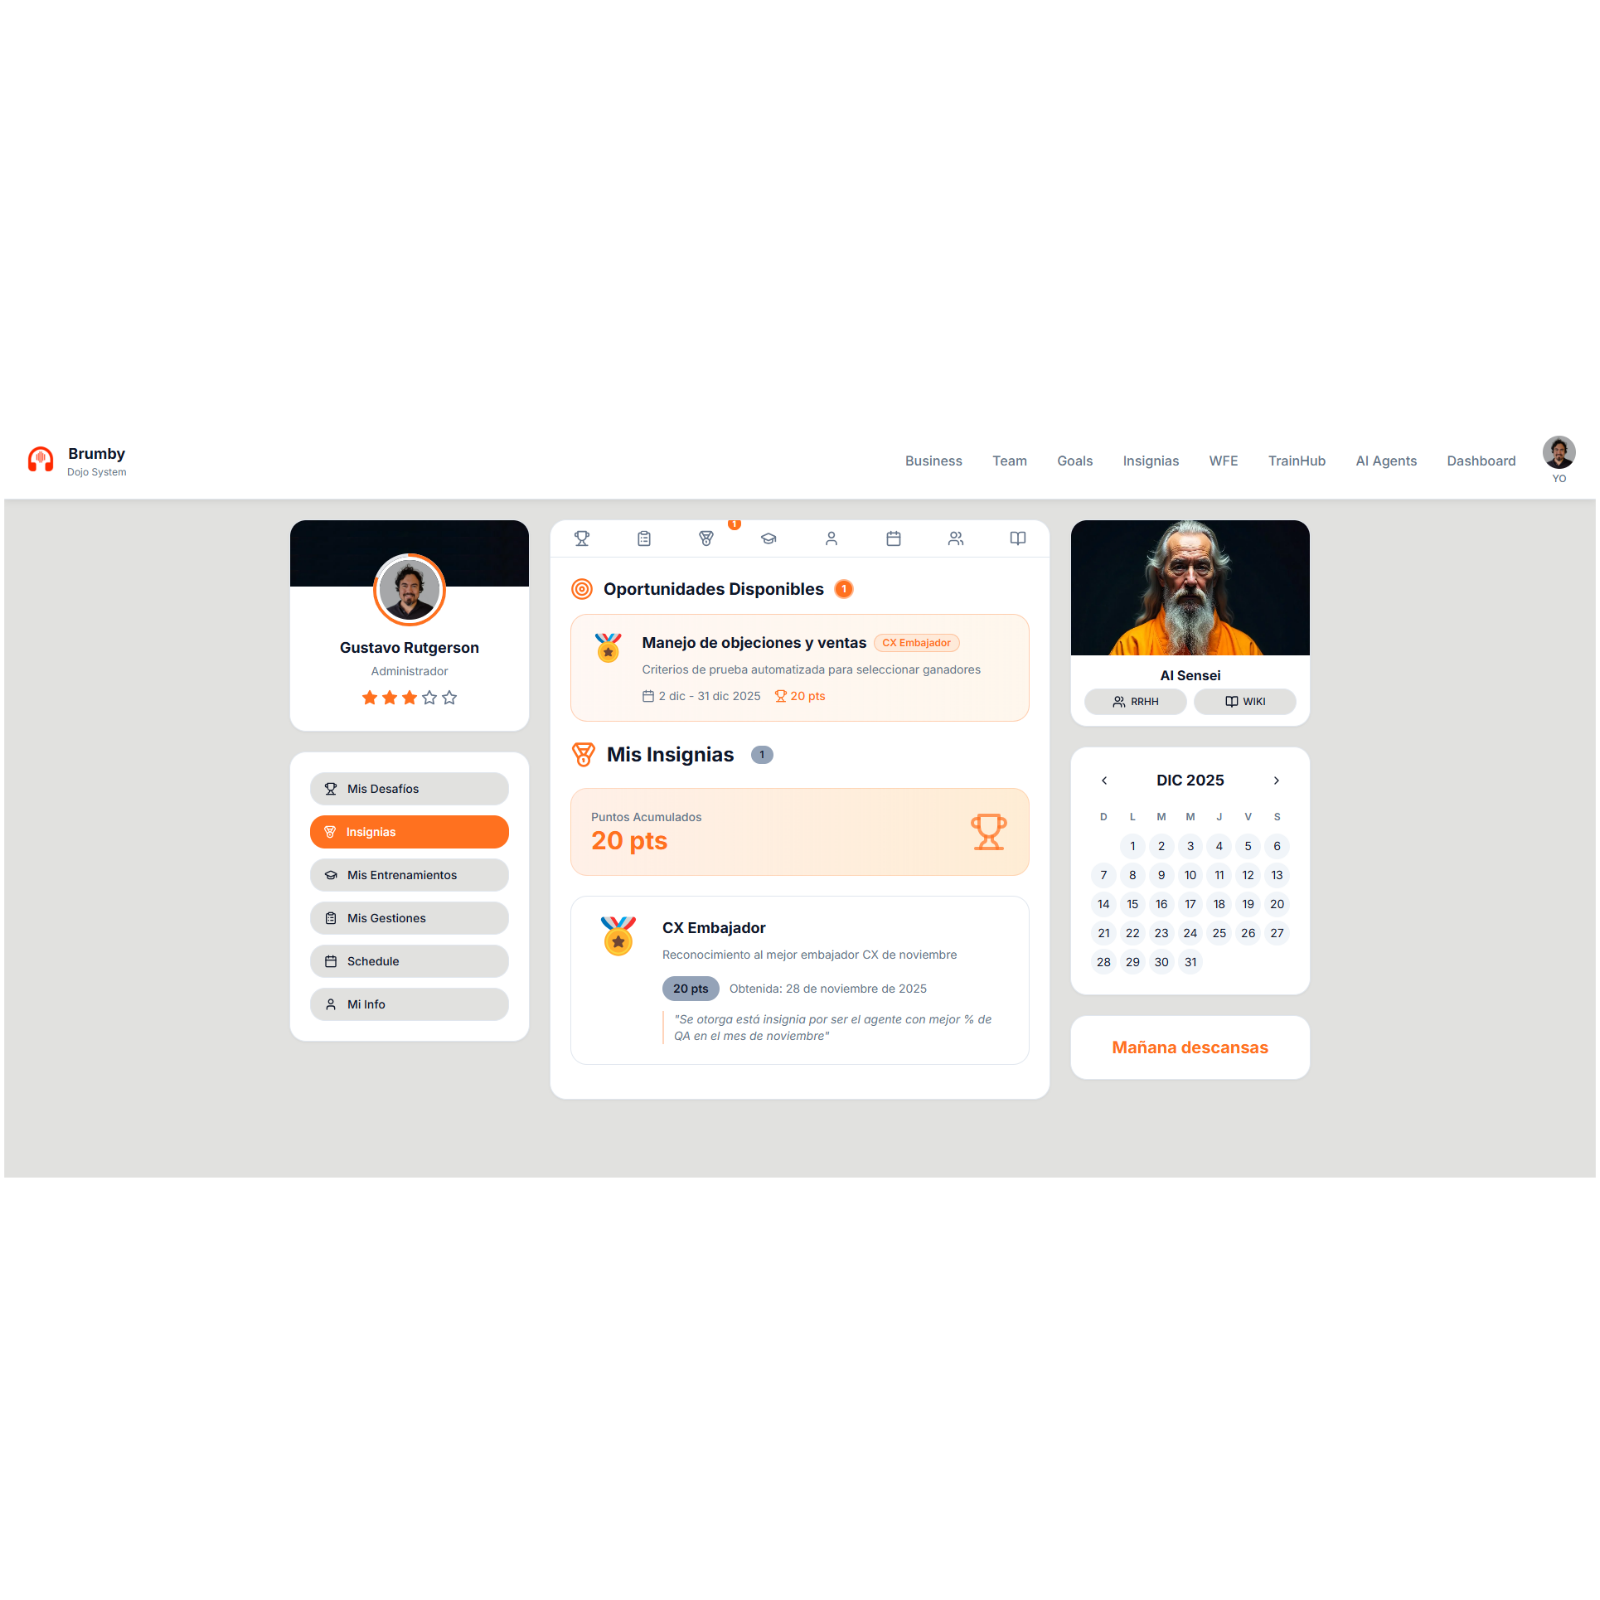
By combining hierarchies and dimensions with smart filters, Brumby precisely segments information. This ensures that each user profile, from agent to director, accesses only the data most relevant to their role.
The result is an information system that not only organizes data but transforms it into effective tools for continuous performance improvement.